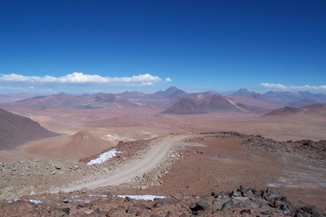
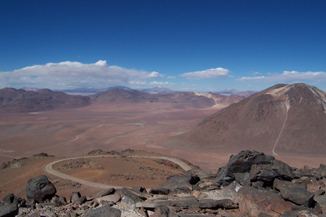
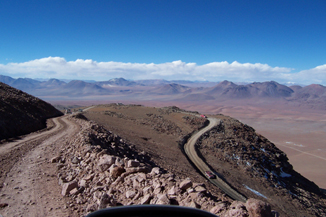
OVERVIEW
Weather stations have been deployed at several sites of interest to the CCAT Project. The data are available in text files in two formats.
Format 1 (.txt)
Format produced by weather station data logger. Data in columns, separated by commas. Comment lines prefaced "#". Occasional extraneous text at ends of lines (mostly excised).
| Column | Quantity | Unit | Remark |
| 1 | unit | id number | |
| 2 | date | yy/mm/dd | |
| 3 | time | hh:mm:ss | time zone depends on unit |
| 4 | wind speed (average) |
m s-1 | average in 15 min interval |
| 5 | wind direction (average) | degrees from North | average in 15 min interval |
| 6 | wind direction variation | degrees |
standard deviation in 15 min interval |
| 7 | wind speed (peak) | m s-1 | peak in 15 min interval |
| 8 | temperature | oC | |
| 9 | relative humidity | % | |
| 10 | pressure | mbar | |
| 11 | battery | V | |
| 12 | zero |
SUMMARY 2006 MAY - 2014 November
| Quantity |
Quartiles
|
Cumul. Distrib.
|
Variations
|
|||||||
|---|---|---|---|---|---|---|---|---|---|---|
|
Min.
|
25%
|
Med.
|
75%
|
Max.
|
Diurnal
|
Seasonal
|
||||
|
Temperature |
-24.8 | -9.4 | -5.9 | -2.8 | 8.9 | |||||
|
Pressure |
500 | 516 | 518 | 519 | 524 | |||||
|
Relative Humidity |
10 | 24 | 50 | |||||||
|
Absolute Humidity |
0.3 | 0.7 | 1.5 | 6.3 | ||||||
|
Wind Speed (peak)† |
7.9 | 11.5 | 15.1 | 204.7 | ||||||
|
Wind Speed (ave.)† |
2.0 | 3.8 | 6.2 | 26.7 | ||||||
† Wind speed peak and average in 15 min intervals.
Events
- 2012 October 27 15:04 UT - Clock 1 min ahead; rest to UT.
- 2011 November 5 16:38 UT - Clock 2 min ahead; reset to UT.
- 2010 April 4 17:05 UT - Clock 2 min ahead; reset to UT.
- 2010 January 26 17:56 UT - Replace anemometer.
- 2009 September 27 14:59 UT - Anemometer broken.
- 2009 March 19 15:08 UT - Clock 3 min ahead; reset to UT.
- 2006 May 11 - Unit 2 installed, clock set to UT.
Yearly and monthly summaries
2014
| Month | Time Series | Distributions | Data | Diurnal |
|---|---|---|---|---|
| 2014 | ||||
| November | txt.zip | |||
| October | txt.zip | |||
| September | txt.zip | |||
| August | txt.zip | |||
| July | txt.zip | |||
| June | txt.zip | |||
| May | txt.zip | |||
| April | txt.zip | |||
| March | txt.zip | |||
| February | txt.zip | |||
| January | txt.zip |
2013
| Month | Time Series | Distributions | Data | Diurnal |
| 2013 | ||||
| December | txt.zip | |||
| November | txt.zip | |||
| October | txt.zip | |||
| September | txt.zip | |||
| August | txt.zip | |||
| July | txt.zip | |||
| June | txt.zip | |||
| May | txt.zip | |||
| April | txt.zip | |||
| March | txt.zip | |||
| February | txt.zip | |||
| January | txt.zip |
2012
| Month | Time Series | Distributions | Data | Diurnal |
|---|---|---|---|---|
| 2012 | ||||
| December | txt.zip | |||
| November | txt.zip | |||
| October | txt.zip | |||
| September | txt.zip | |||
| August | txt.zip | |||
| July | txt.zip | |||
| June | txt.zip | |||
| May | txt.zip | |||
| April | txt.zip | |||
| March | txt.zip | |||
| February | txt.zip | |||
| January | txt.zip |
2011
| Month | Time Series | Distributions | Data | Diurnal |
|---|---|---|---|---|
| 2011 | ||||
| December | txt.zip | |||
| November | txt.zip | |||
| October | txt.zip | |||
| September | txt.zip | |||
| August | txt.zip | |||
| July | txt.zip | |||
| June | txt.zip | |||
| May | txt.zip | |||
| April | txt.zip | |||
| March | txt.zip | |||
| February | txt.zip | |||
| January | txt.zip |
2010
| Month | Time Series | Distributions | Data | Diurnal |
|---|---|---|---|---|
| 2010 | ||||
| December | txt.zip | |||
| November | txt.zip | |||
| October | txt.zip | |||
| September | txt.zip | |||
| August | txt.zip | |||
| July | txt.zip | |||
| June | txt.zip | |||
| May | txt.zip | |||
| April | txt.zip | |||
| March | txt.zip | |||
| February | txt.zip | |||
| January | txt.zip |
2009
| Month | Time Series | Distributions | Data | Diurnal |
|---|---|---|---|---|
| 2009 | ||||
| December | txt.zip | |||
| November | txt.zip | |||
| October | txt.zip | |||
| September | txt.zip | |||
| August | txt.zip | |||
| July | txt.zip | |||
| June | txt.zip | |||
| May | txt.zip | |||
| April | txt.zip | |||
| March | txt.zip | |||
| February | txt.zip | |||
| January | txt.zip |
2008
| Month | Time Series | Distributions | Data | Diurnal |
|---|---|---|---|---|
| 2008 | ||||
| December | txt.zip | |||
| November | txt.zip | |||
| October | txt.zip | |||
| September | txt.zip | |||
| August | txt.zip | |||
| July | txt.zip | |||
| June | txt.zip | |||
| May | txt.zip | |||
| April | txt.zip | |||
| March | txt.zip | |||
| February | txt.zip | |||
| January | txt.zip |
2007
| Month | Time Series | Distributions | Data | Diurnal |
|---|---|---|---|---|
| 2007 | ||||
| December | txt.zip | |||
| November | txt.zip | |||
| October | txt.zip | |||
| September | txt.zip | |||
| August | txt.zip | |||
| July | txt.zip | |||
| June | txt.zip | |||
| May | txt.zip | |||
| April | txt.zip | |||
| March | txt.zip | |||
| February | txt.zip | |||
| January | txt.zip |
2006
| Month | Time Series | Distributions | Data | Diurnal |
|---|---|---|---|---|
| 2006 | ||||
| December | txt.zip | |||
| November | txt.zip | |||
| October | txt.zip | |||
| September | txt.zip | |||
| August | txt.zip | |||
| July | txt.zip | |||
| June | txt.zip | |||
| May | txt.zip |

